Follow us on social media :
Free Demo
+33 (0)1 84 20 33 05
Free demo
+33 (0)1 84 20 33 05

Price history

Analyze two years of price trends for every monitored product, reseller and competitor.

REQUEST YOUR PERSONALIZED DEMO

Visualize price trends over two years

Price Observatory records the price of every monitored product daily across more than 6,000 sites in 70+ countries. You get access to two years of history including selling prices, strikethrough prices, promotions, shipping costs and stock levels. Every data point is timestamped and can be filtered by reseller, marketplace or geographic region for immediate, granular analysis.
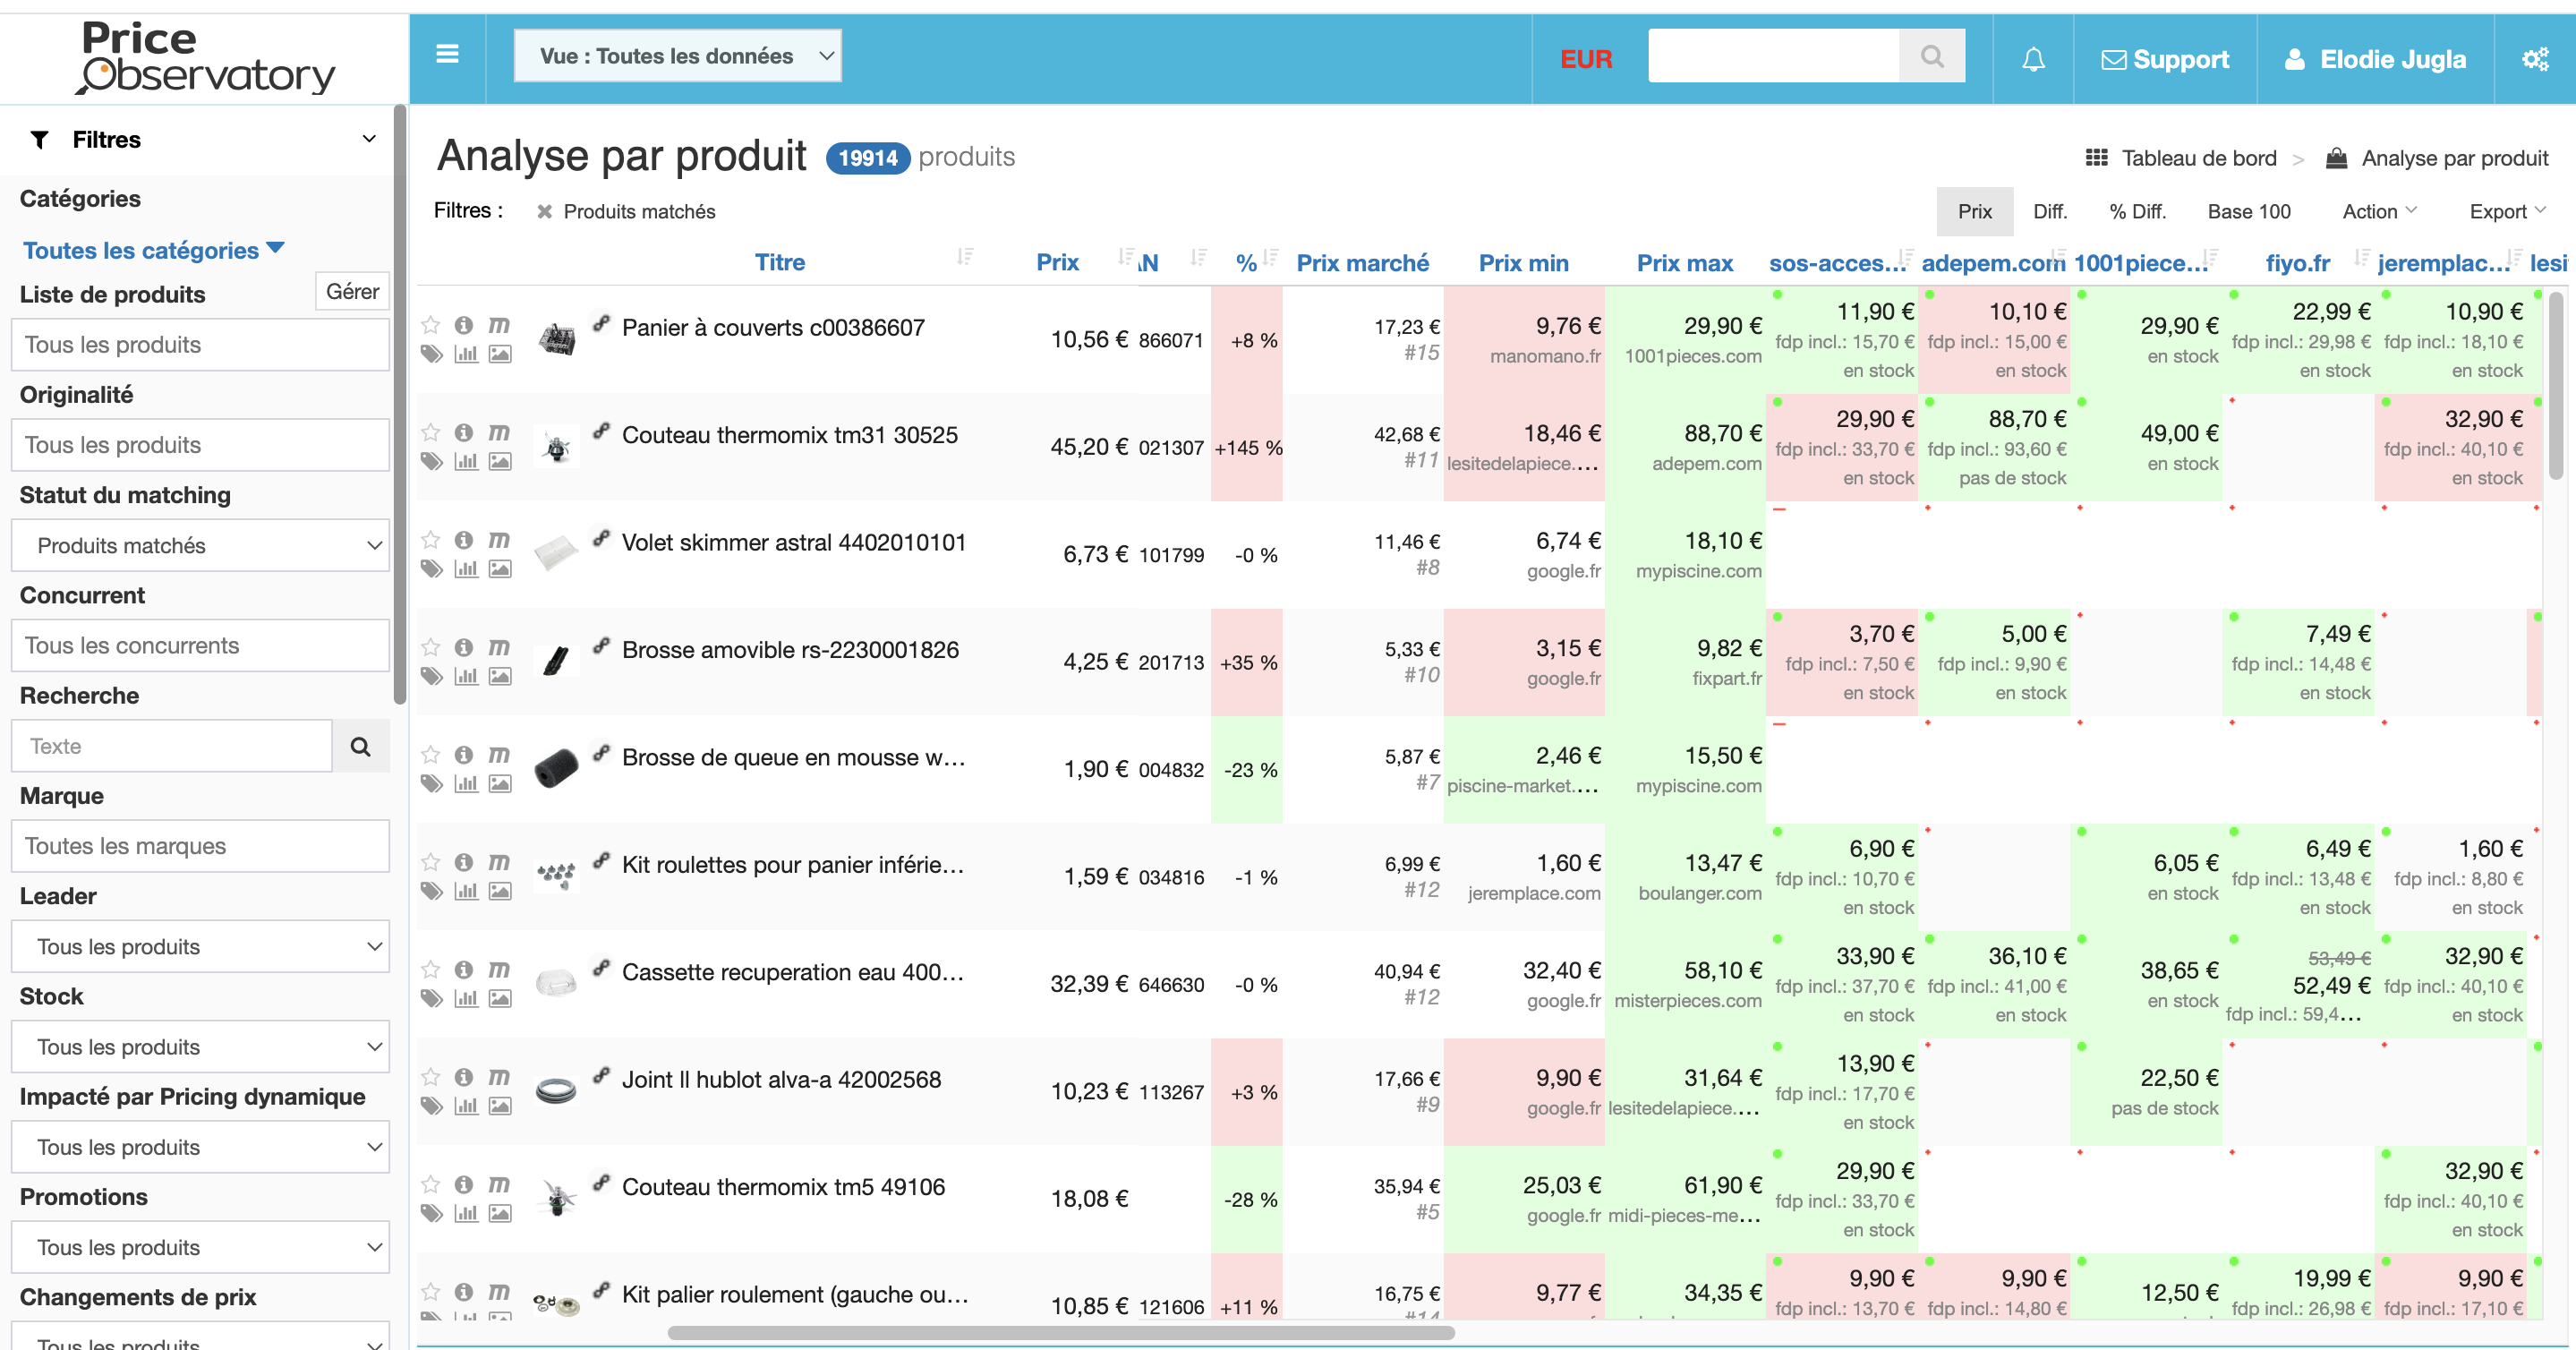
Four capabilities to put your data to work

Review detailed price curves

Display price trends product by product over 24 months, with strikethrough prices, promotions and shipping costs included.

Compare several resellers in one view

Overlay the price curves of your competitors or distributors to identify gaps and shared trends.

Detect seasonal and promotional cycles

Spot recurring periods of price increases or decreases so you can plan your price adjustments precisely.

Export the data for your reporting

Download the full history in CSV or via API to feed your BI tools, ERP or internal presentations.

How it works

1.

Import your product catalog

Send your feed via CSV, API or a connector. Price Observatory runs the matching and starts daily collection.

2.

Review the history curves

Access charts by product, reseller or competitor from your dashboard, with filters by country and time period.

3.

Analyze, set alerts and export

Identify trends, configure alerts on price thresholds and export the data to support your pricing decisions.
Try price history right now
Access two years of pricing data collected daily on your products, resellers and competitors. Visualize trends, document your decisions and export your analyses in a few clicks.
GET STARTED

What sets Price Observatory apart on price history

Two years of data collected daily across more than 6,000 sites in 70+ countries, with consistent day-by-day granularity.
Scraping robots developed in-house and validated by quality engineers to guarantee the accuracy of every recorded data point.
Enriched history covering strikethrough prices, promotions, stock levels and shipping costs — not just the raw selling price on display.

Frequently asked questions about price history

The history covers up to two years of data with daily granularity. You can filter by product, reseller, marketplace or country to get exactly the view you need.
Yes. History can be exported to CSV or via API and is compatible with Shopify, Prestashop, Google Merchant Center, Power BI, Tableau and any ERP that accepts structured imports.
The history starts on the date monitoring is activated for each product and site. There is no retroactive data, but daily collection quickly builds a usable base.

For brands

MONITORING of resellers’ prices
market and distribution network analysis
Learn more

You are at
the right place !

For e-retailers

monitoring OF COMPETITORS PRICING
OVERVIEW OF pricing
positioning
Learn more
chevron-down