Follow us on social media :
Free Demo
+33 (0)1 84 20 33 05
Free demo
+33 (0)1 84 20 33 05

BI dashboard and KPIs

Centralize all your pricing indicators in interactive dashboards updated daily.

REQUEST YOUR PERSONALIZED DEMO

Drive your pricing strategy from a single interface

The BI dashboard and KPI module surfaces all of your price monitoring data in real time: price positioning, competitiveness rate, margin trends, digital distribution, Buy Box rate and MAP compliance. The indicators are fed daily by our robots covering more than 6,000 sites in more than 70 countries. You can filter by product, category, competitor, channel or country, right down to the individual SKU.
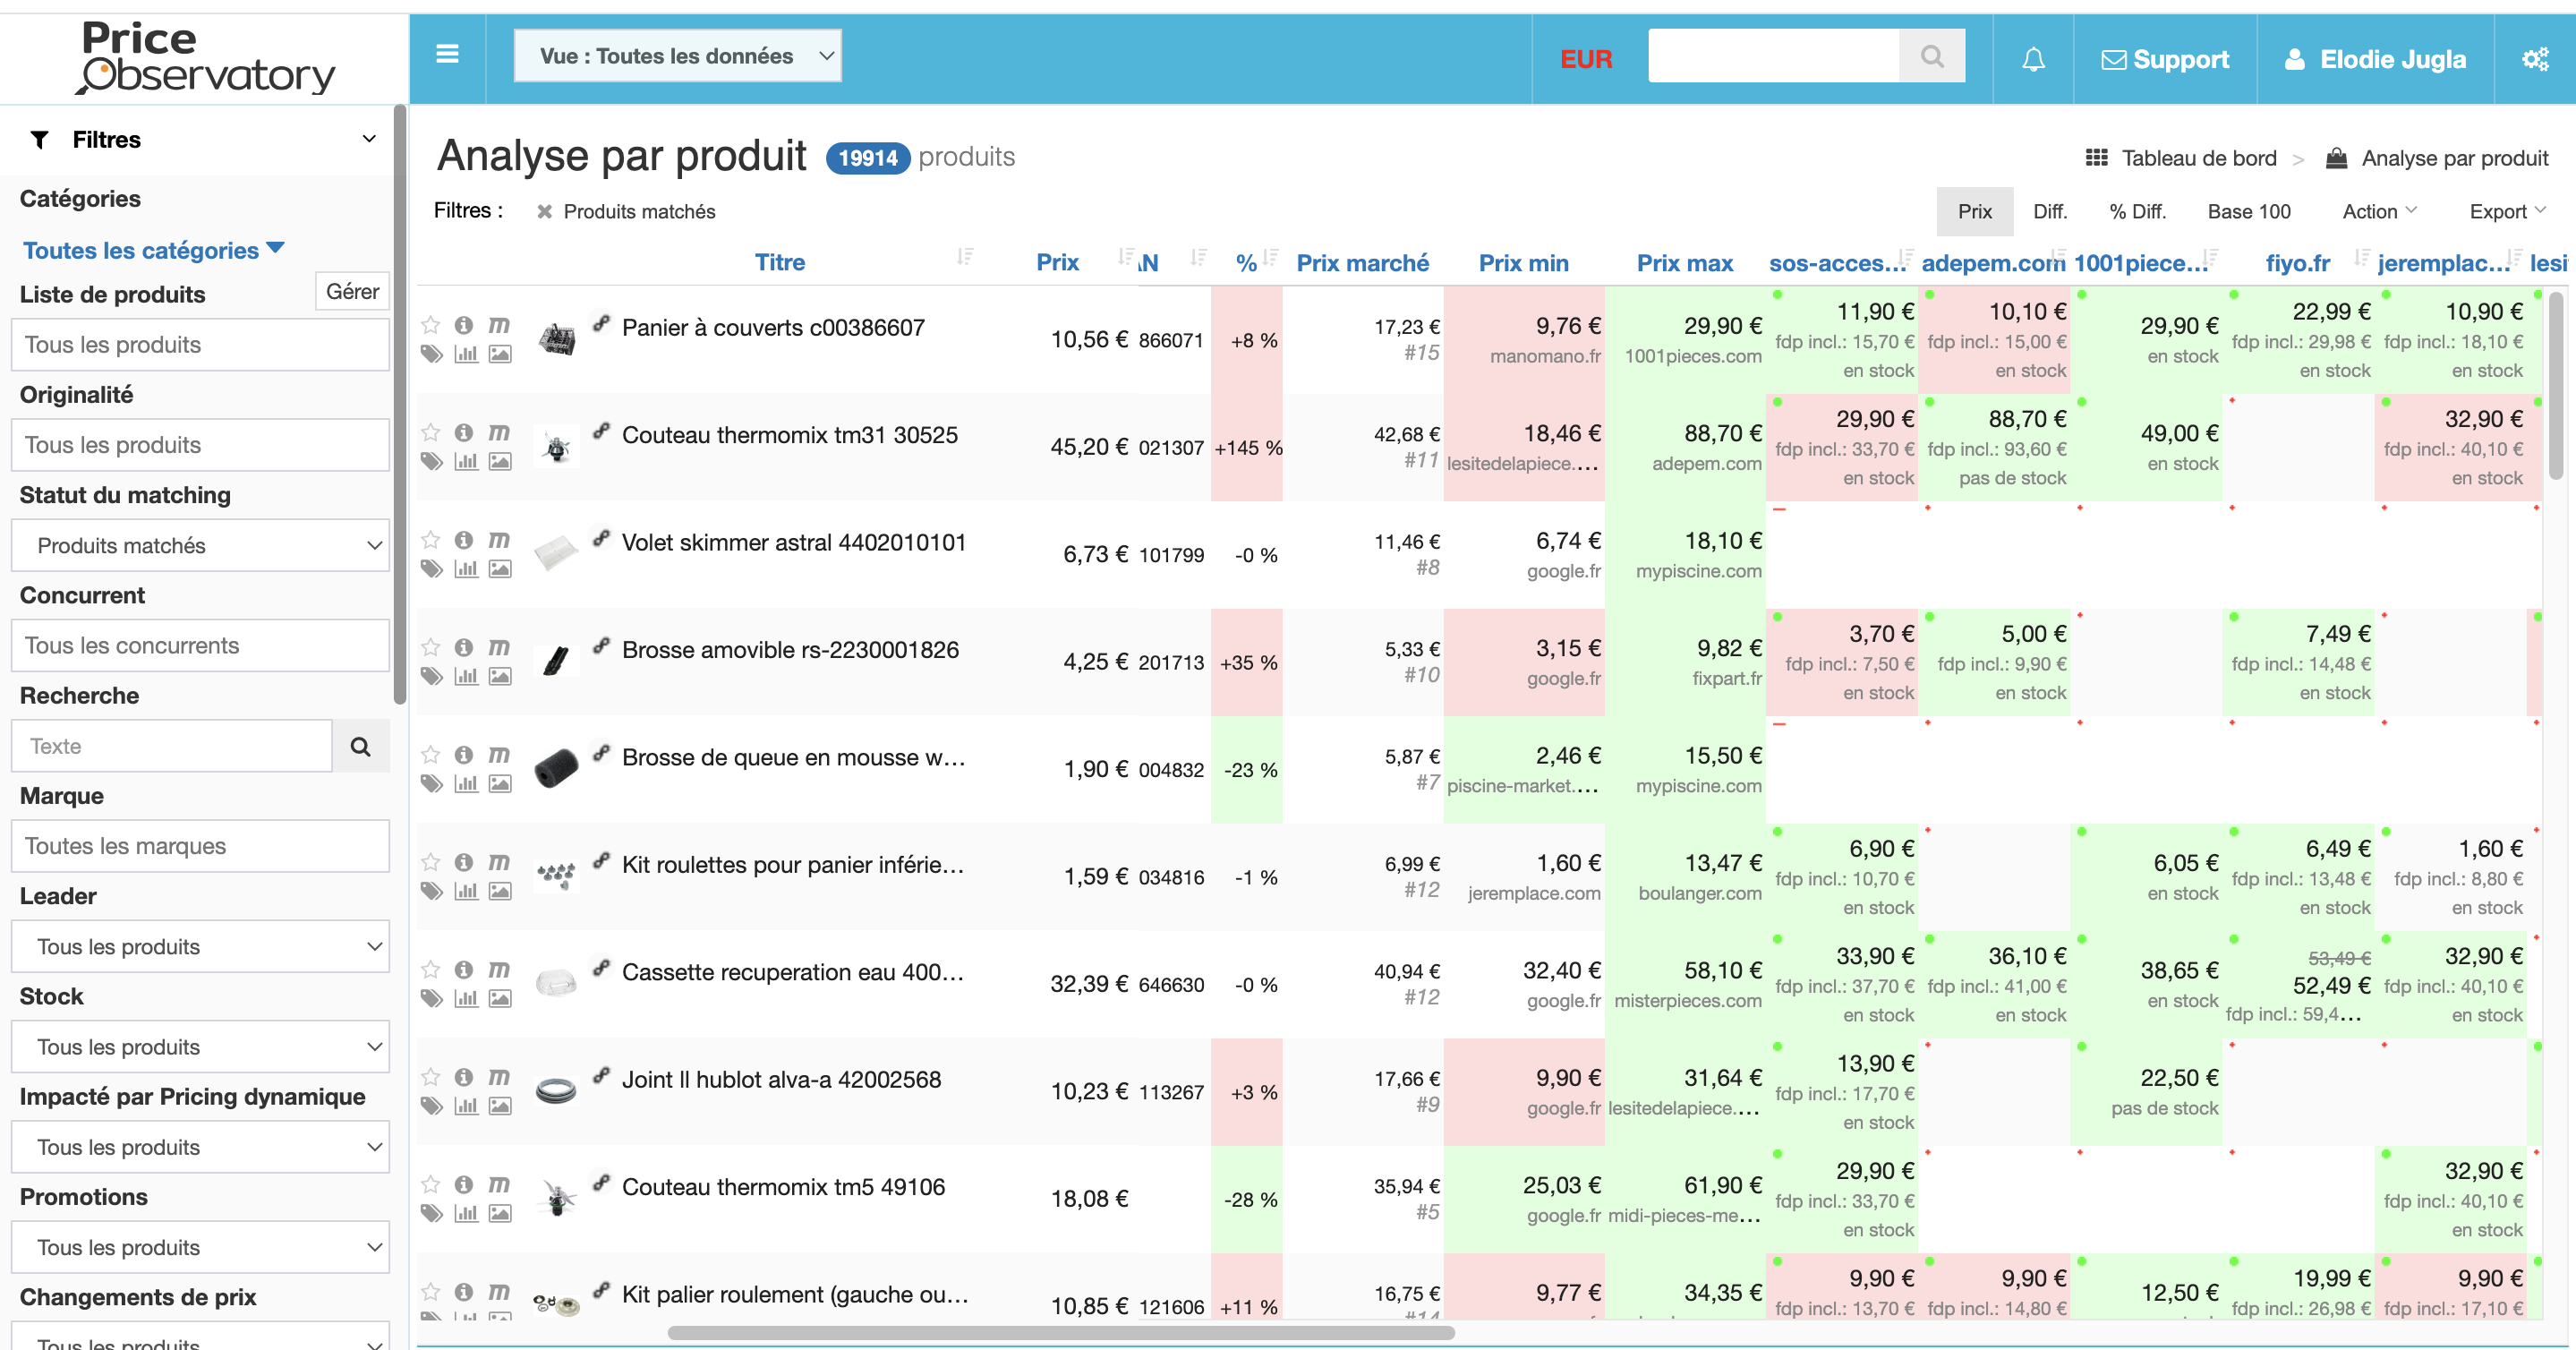
Four capabilities for fast, well-informed decisions

Visualize your essential pricing KPIs

Review price positioning, competitiveness, margins and MAP compliance in a single interface, refreshed every day with two years of history.

Filter by product, channel and country

Refine your analysis by category, competitor, time period or sales channel to isolate the data that matters, down to the individual SKU.

Generate custom, exportable reports

Build tailored reports by segment, product range or country and export them to CSV to feed your management reviews.

Set alerts on critical thresholds

Define thresholds on your key indicators — margin, price, Buy Box — and get an automatic notification as soon as they are crossed.

How it works

1.

Configure your KPIs and filters

Select your priority indicators and define your scope: products, competitors, channels, countries.

2.

Analyze the dashboards

Review your data as it updates daily, identify trends and spot significant gaps.

3.

Act and share the results

Export your reports, trigger repricing actions or pass alerts on to your teams.
Try the BI dashboard and KPIs right now
Access your consolidated pricing indicators in a single interface, with reliable data covering more than 70 countries and two years of history. See what the dashboard can do for you.
GET STARTED

What sets the Price Observatory dashboard apart

Data collected by robots developed in-house, covering more than 6,000 sites in more than 70 countries, with reliability verified by our quality engineers.
Two years of price history built natively into every dashboard, so you can run complete trend analysis without any additional third-party tool.
An intuitive interface you can master in thirty minutes thanks to the included training. KPIs are customizable to your profile: brand or e-commerce retailer.

Frequently asked questions about the BI dashboard and KPIs

Data is updated daily by default. The collection frequency can be adjusted to your specific needs, in agreement with your Price Observatory account manager.
Yes. Data can be exported via API, CSV feed or a direct Google Merchant Center connection. You can feed it into tools such as Tableau or Power BI.
All you need to do is send us your product feed. Price Observatory handles matching and collection. Configuring KPIs and filters takes about thirty minutes with the included training.

For brands

MONITORING of resellers’ prices
market and distribution network analysis
Learn more

You are at
the right place !

For e-retailers

monitoring OF COMPETITORS PRICING
OVERVIEW OF pricing
positioning
Learn more
chevron-down